Analog Data Visualization Sketches
Data Visualization
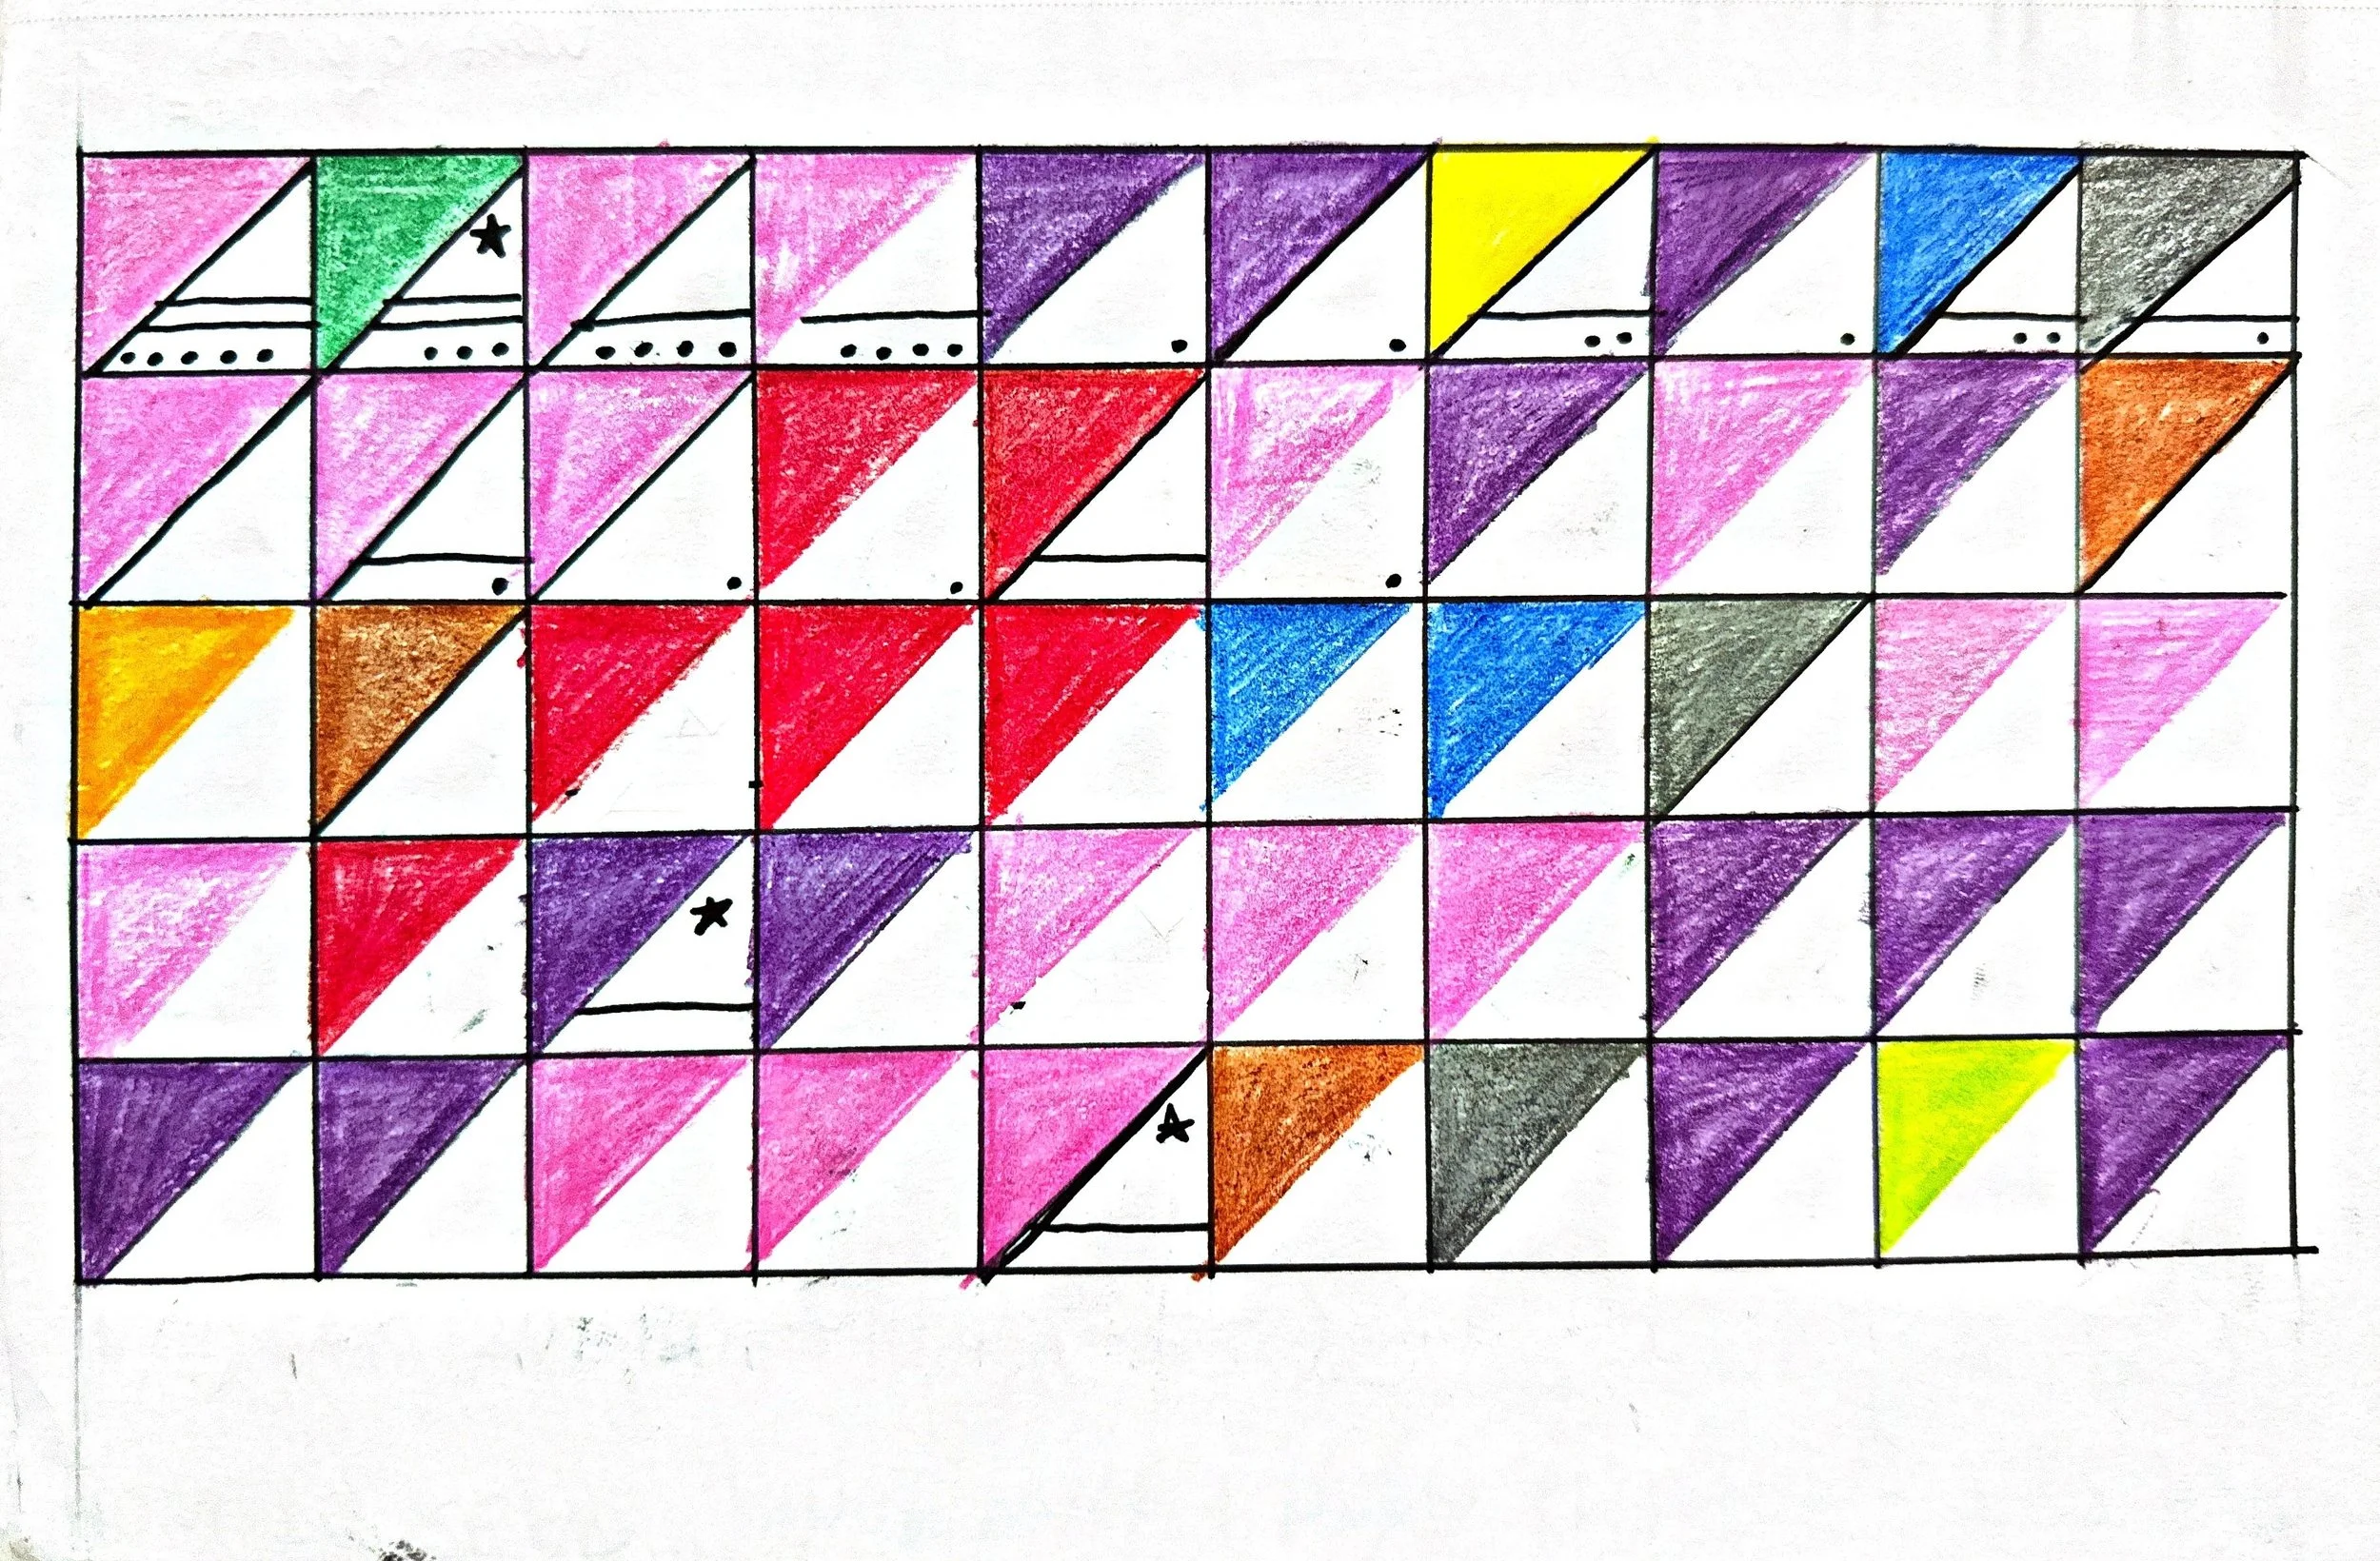
Inspired by the project Dear Data, these projects reimagine my personal data by creating visual, hand-drawn illustrations and turning everyday information into personal, artful storytelling.
This collection showcases the art of data visualization through hand-drawn techniques. Each piece translates complex datasets into visually compelling narratives, using line, shape, and texture to communicate information with clarity and creativity.
The drawings merge precision with artistic expression, offering a unique analog approach to understanding data in a world dominated by digital methods. Explore how I visualize data about myself!
Role
Project Lead, Data Collector, Data Analyst
Tools Used
Microsoft Excel, Tableau, Analog Materials - Sketchbook, Pencils
Process Overview
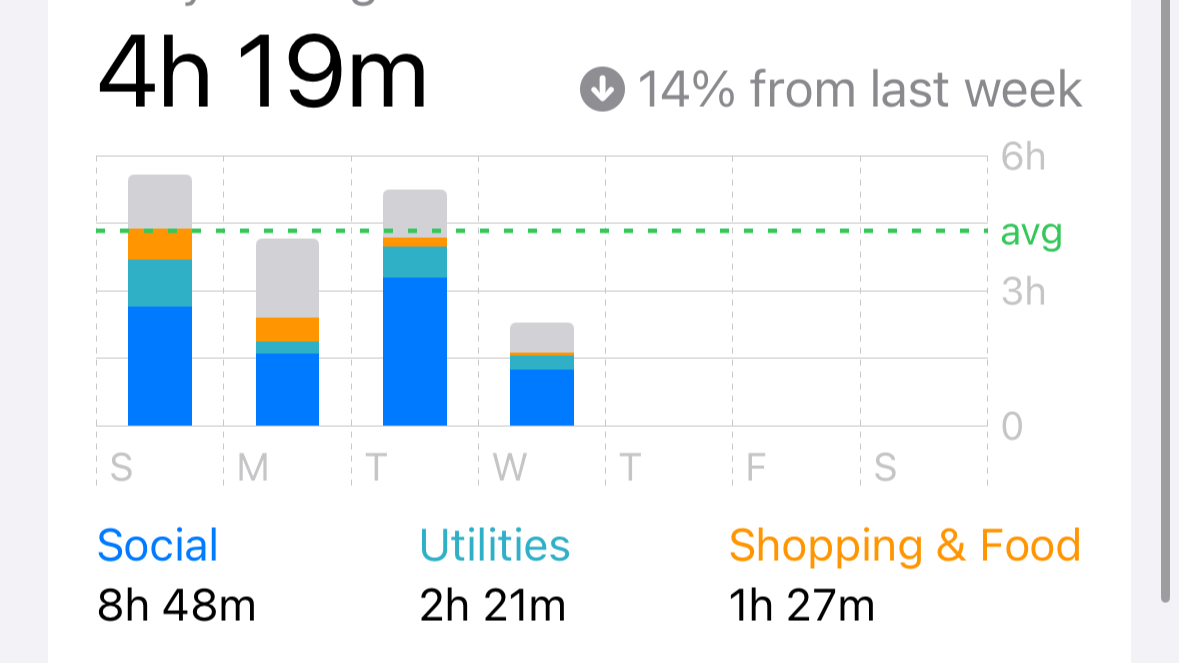
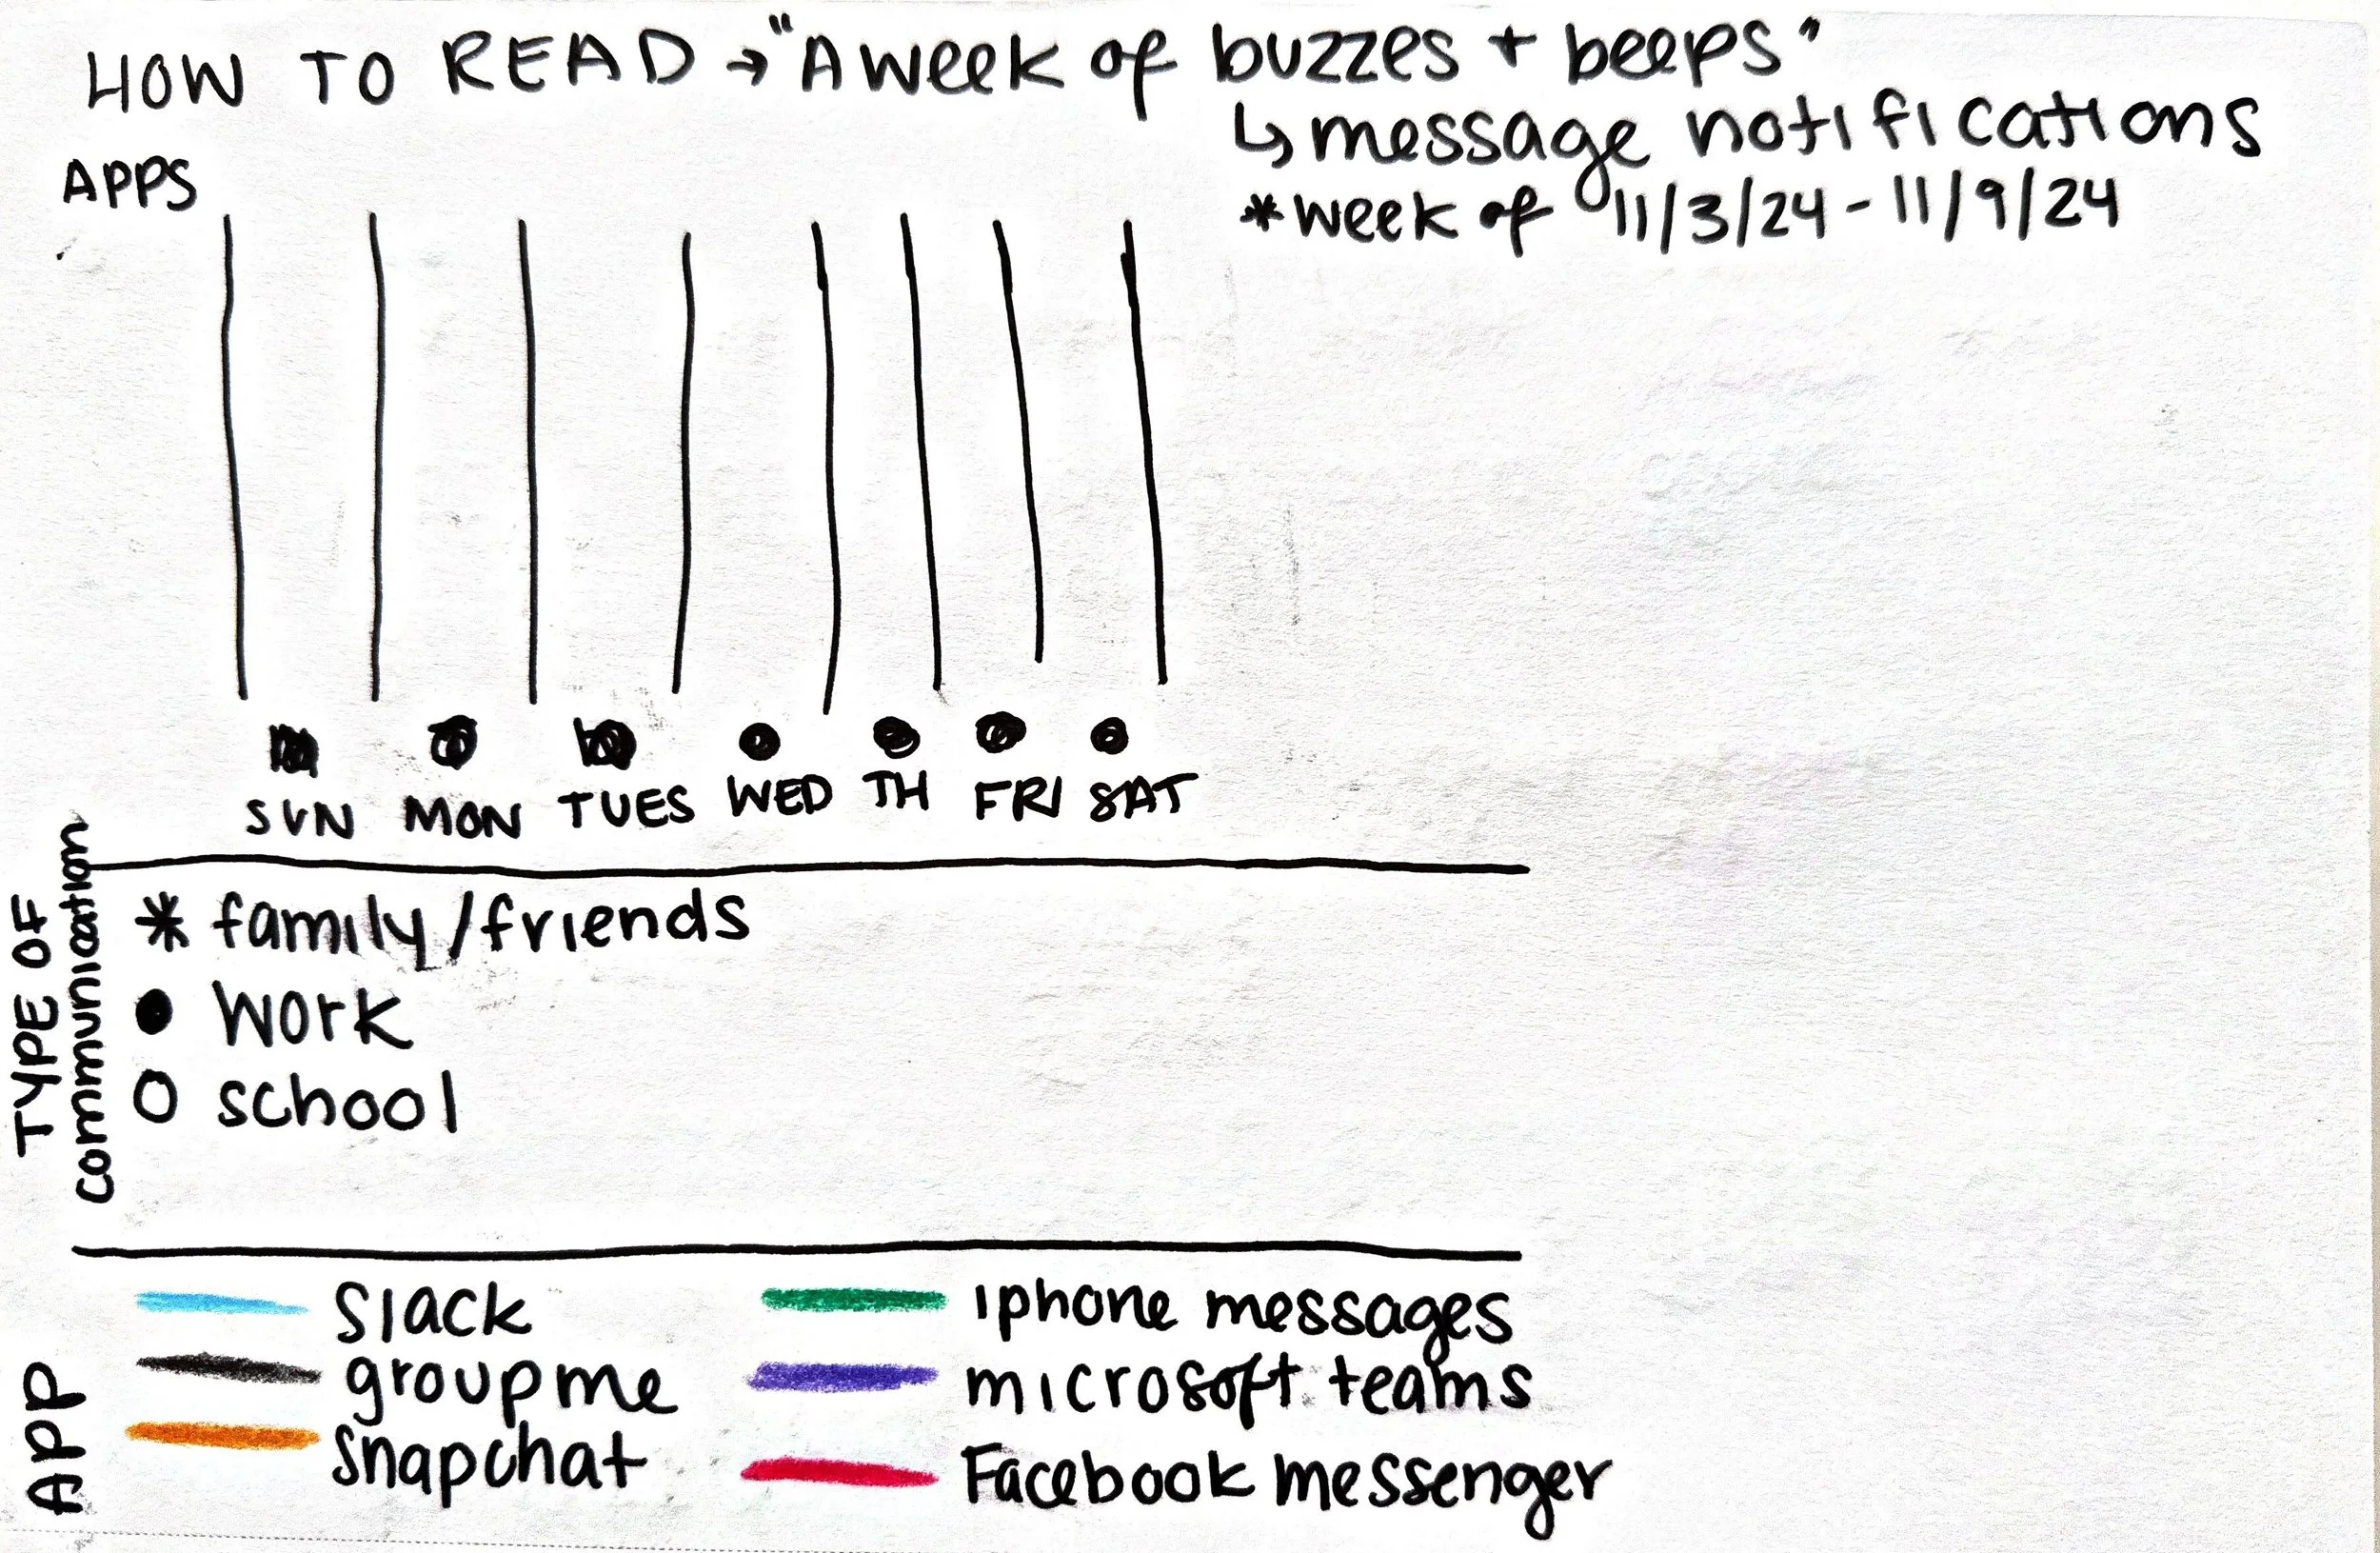
DATA COLLECTION
Captured daily routines and behaviors using phone activity and app-engagement data.
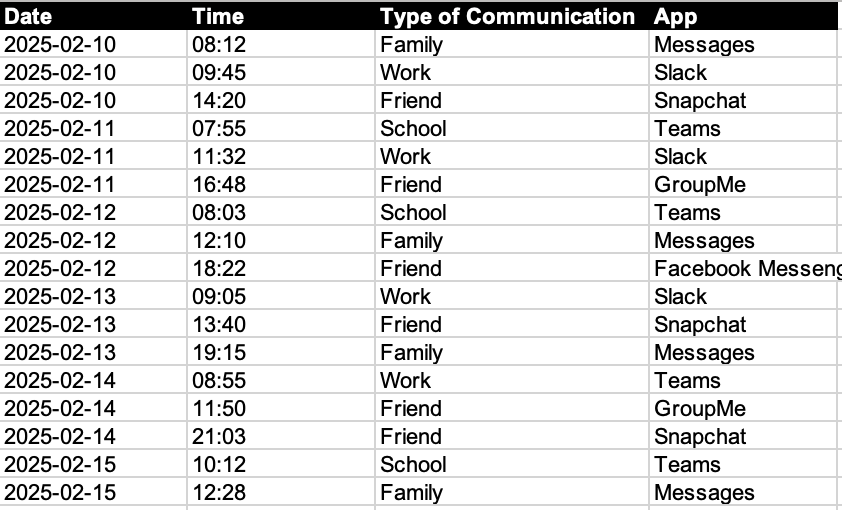
DATA ANALYSIS
Organized and coded exported data in Excel to uncover patterns and meaningful categories.
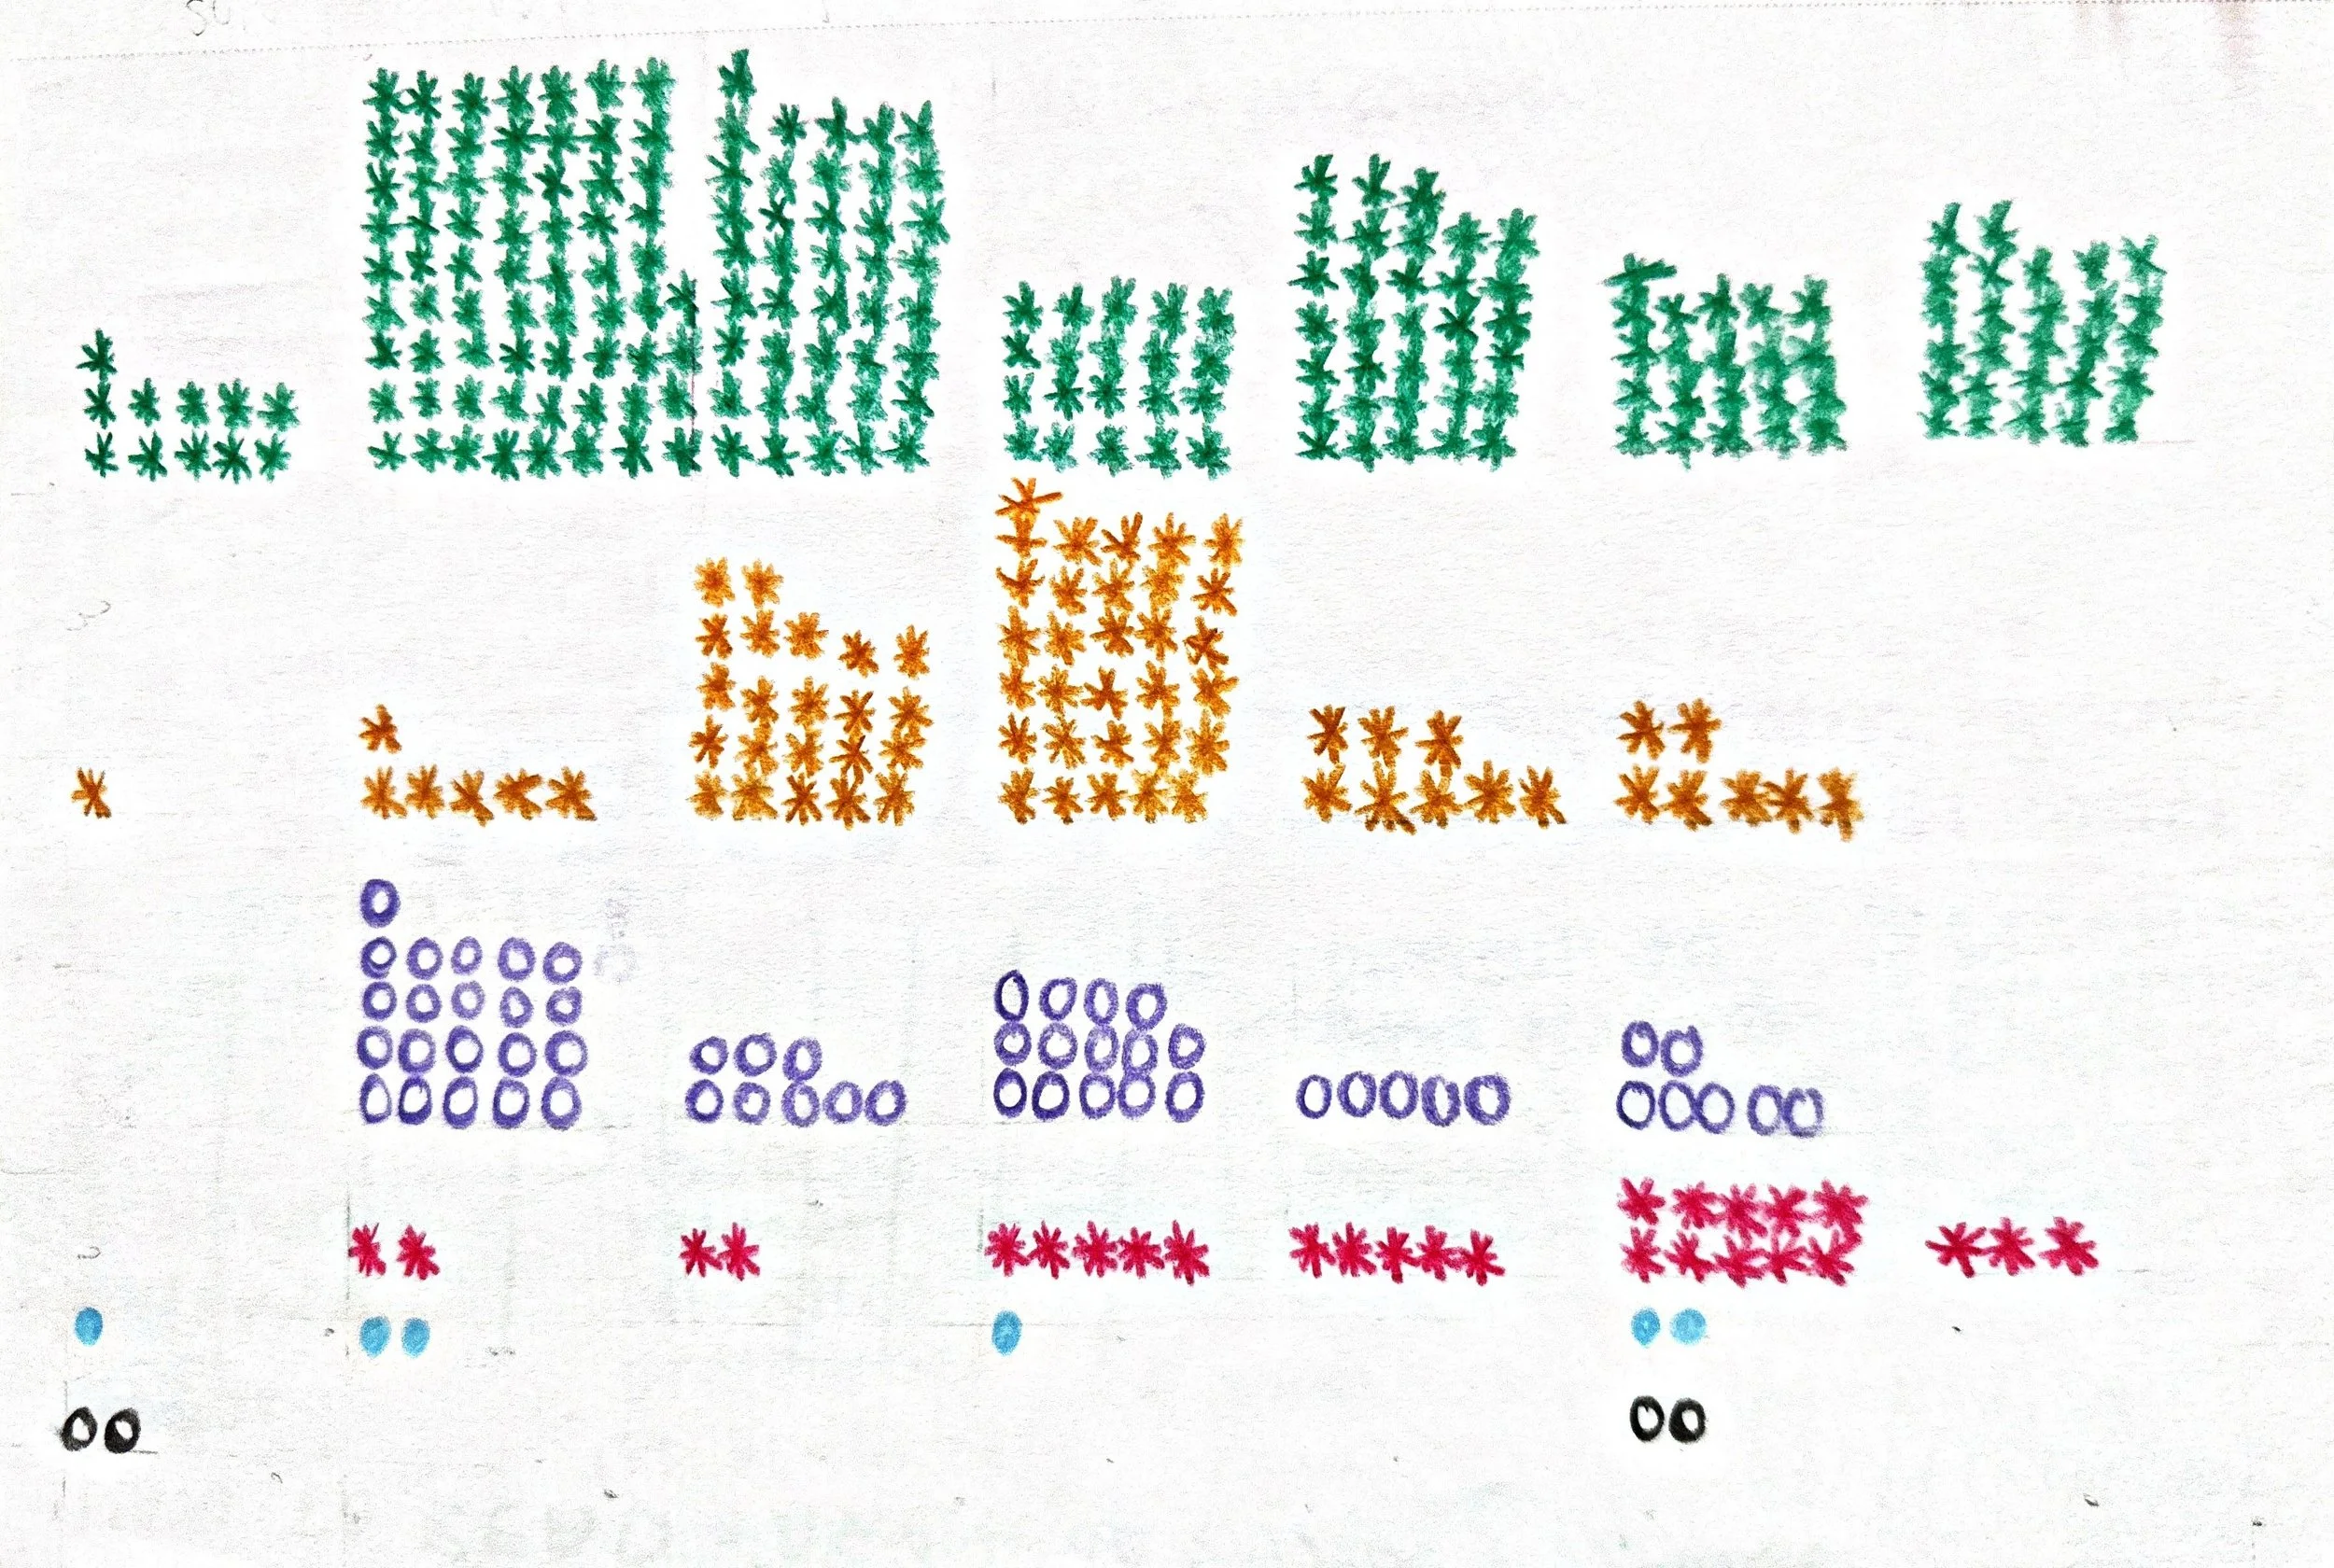
DATA SKETCH
Assigned colors and explored shape-based visual structures to translate coded data into analog visuals.